Online spam is a problem we’re all familiar with, whether it’s emails, texts, or social media DMs, most of us receive some sort of spam every day. But just how big is the problem, and how much has spam exploded in recent years? Could AI have had an impact on the growing levels of online spam?
We’ve put together some of the most intriguing spam statistics, alongside data from our own survey to investigate where the most spam comes from and just how much money spammers can make.
Key statistics
- In 2023, 45.6% of all emails were classified as spam. By 2025, that figure had risen to nearly 52%, meaning more than one in every two emails sent worldwide is unwanted.
- The majority of people (96.8%) have received spam messages in some form.
- Russia generated 32.5% of global spam emails world, making them the biggest source of unsolicited messages. Following them are China and the United States. (Statista, 2025)
- The most common topic of spam emails is prizes and giveaways, followed by job opportunities, and banking.
- Over two-thirds (68.8%) of people who had received spam and/or phishing messages reported their mental health being impacted at least a little as a result.
- Professional services are the most targeted sector in phishing attacks (18%), followed by manufacturing (16%) and retail/wholesale (9%).
- Delivery services were the most common subject of spam text messages in the U.S. in the first half of 2023, with over 1.1 billion scam texts relating to this topic.
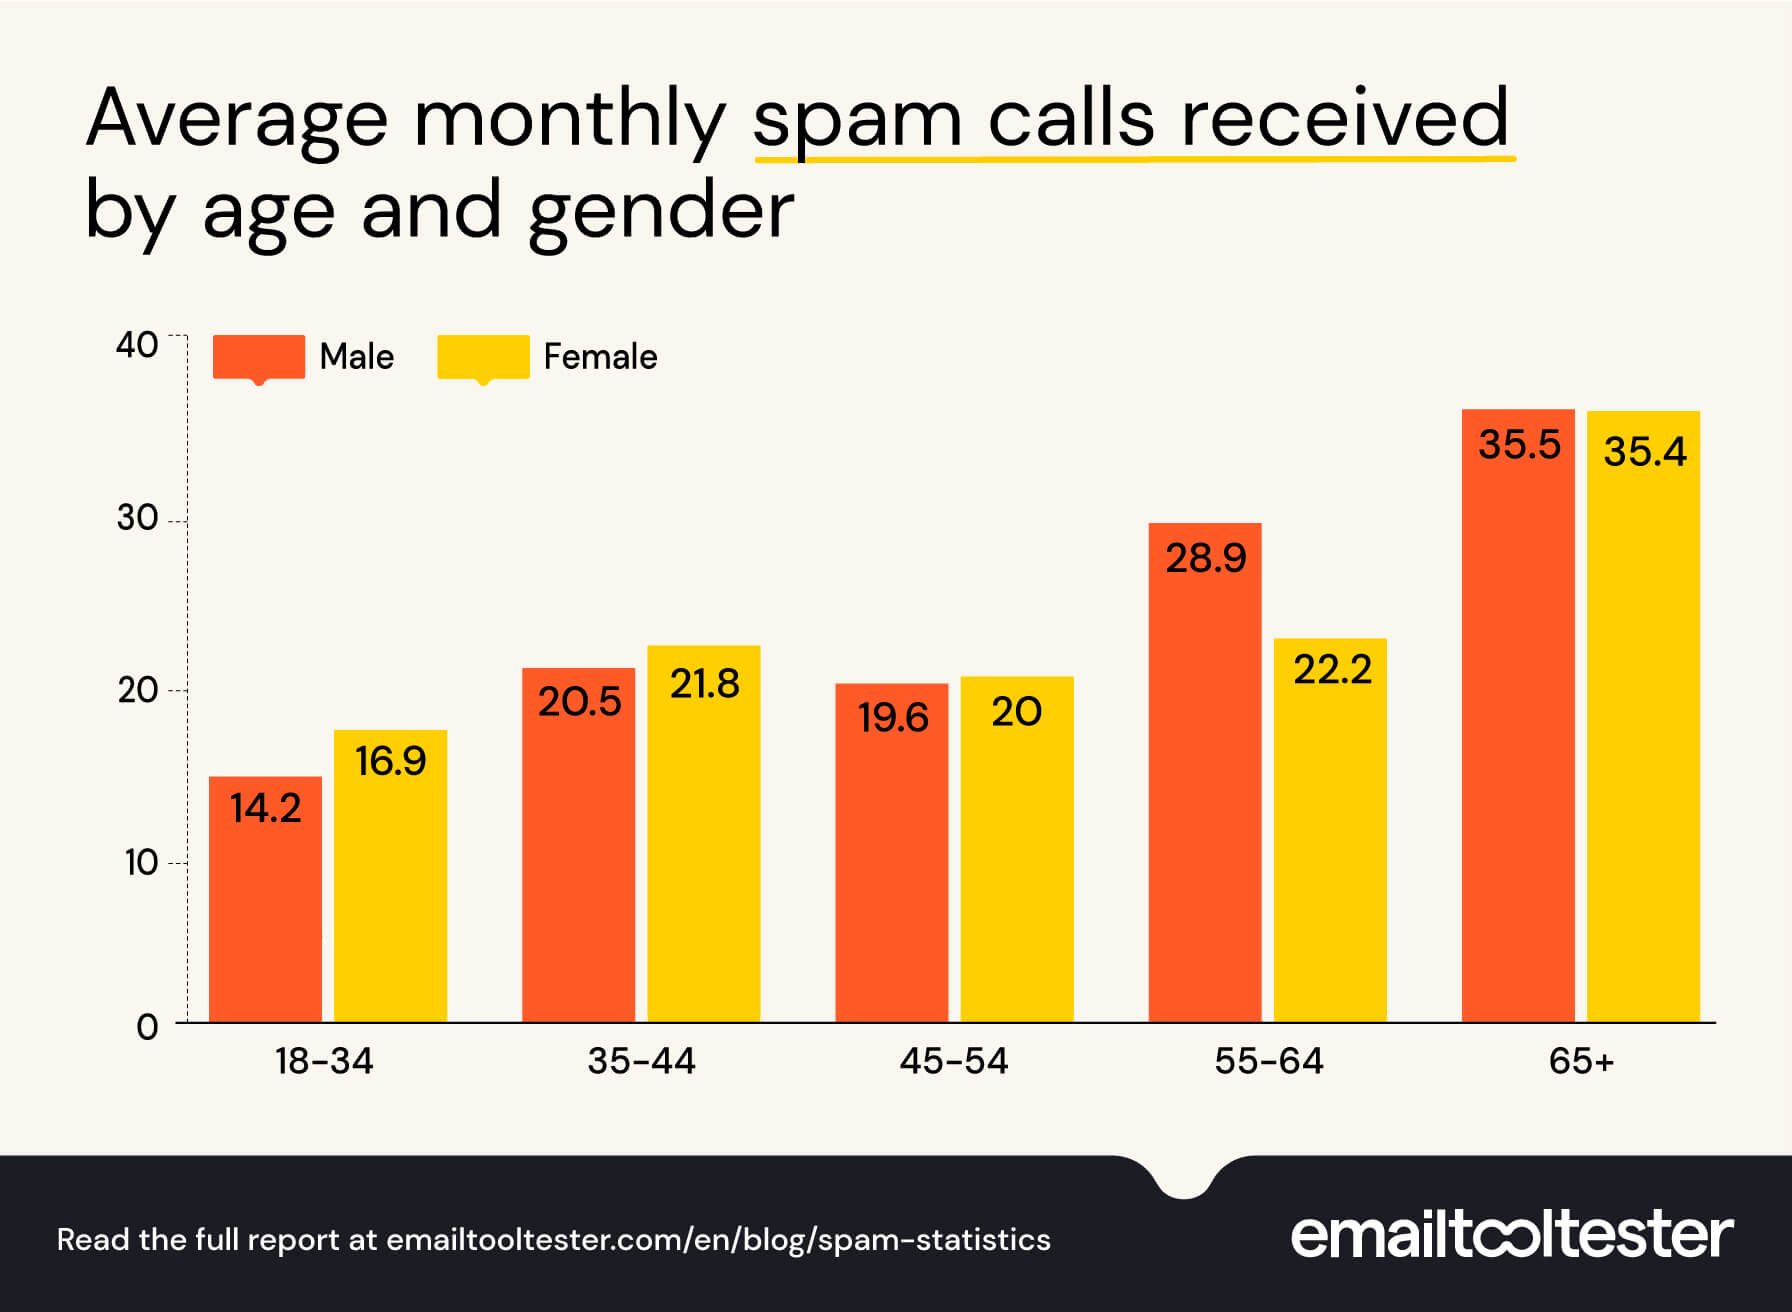
- Men aged 65 and over receive the most spam calls with an average of 35.5 calls per month, while men aged 18-34 receive the fewest (14.2).
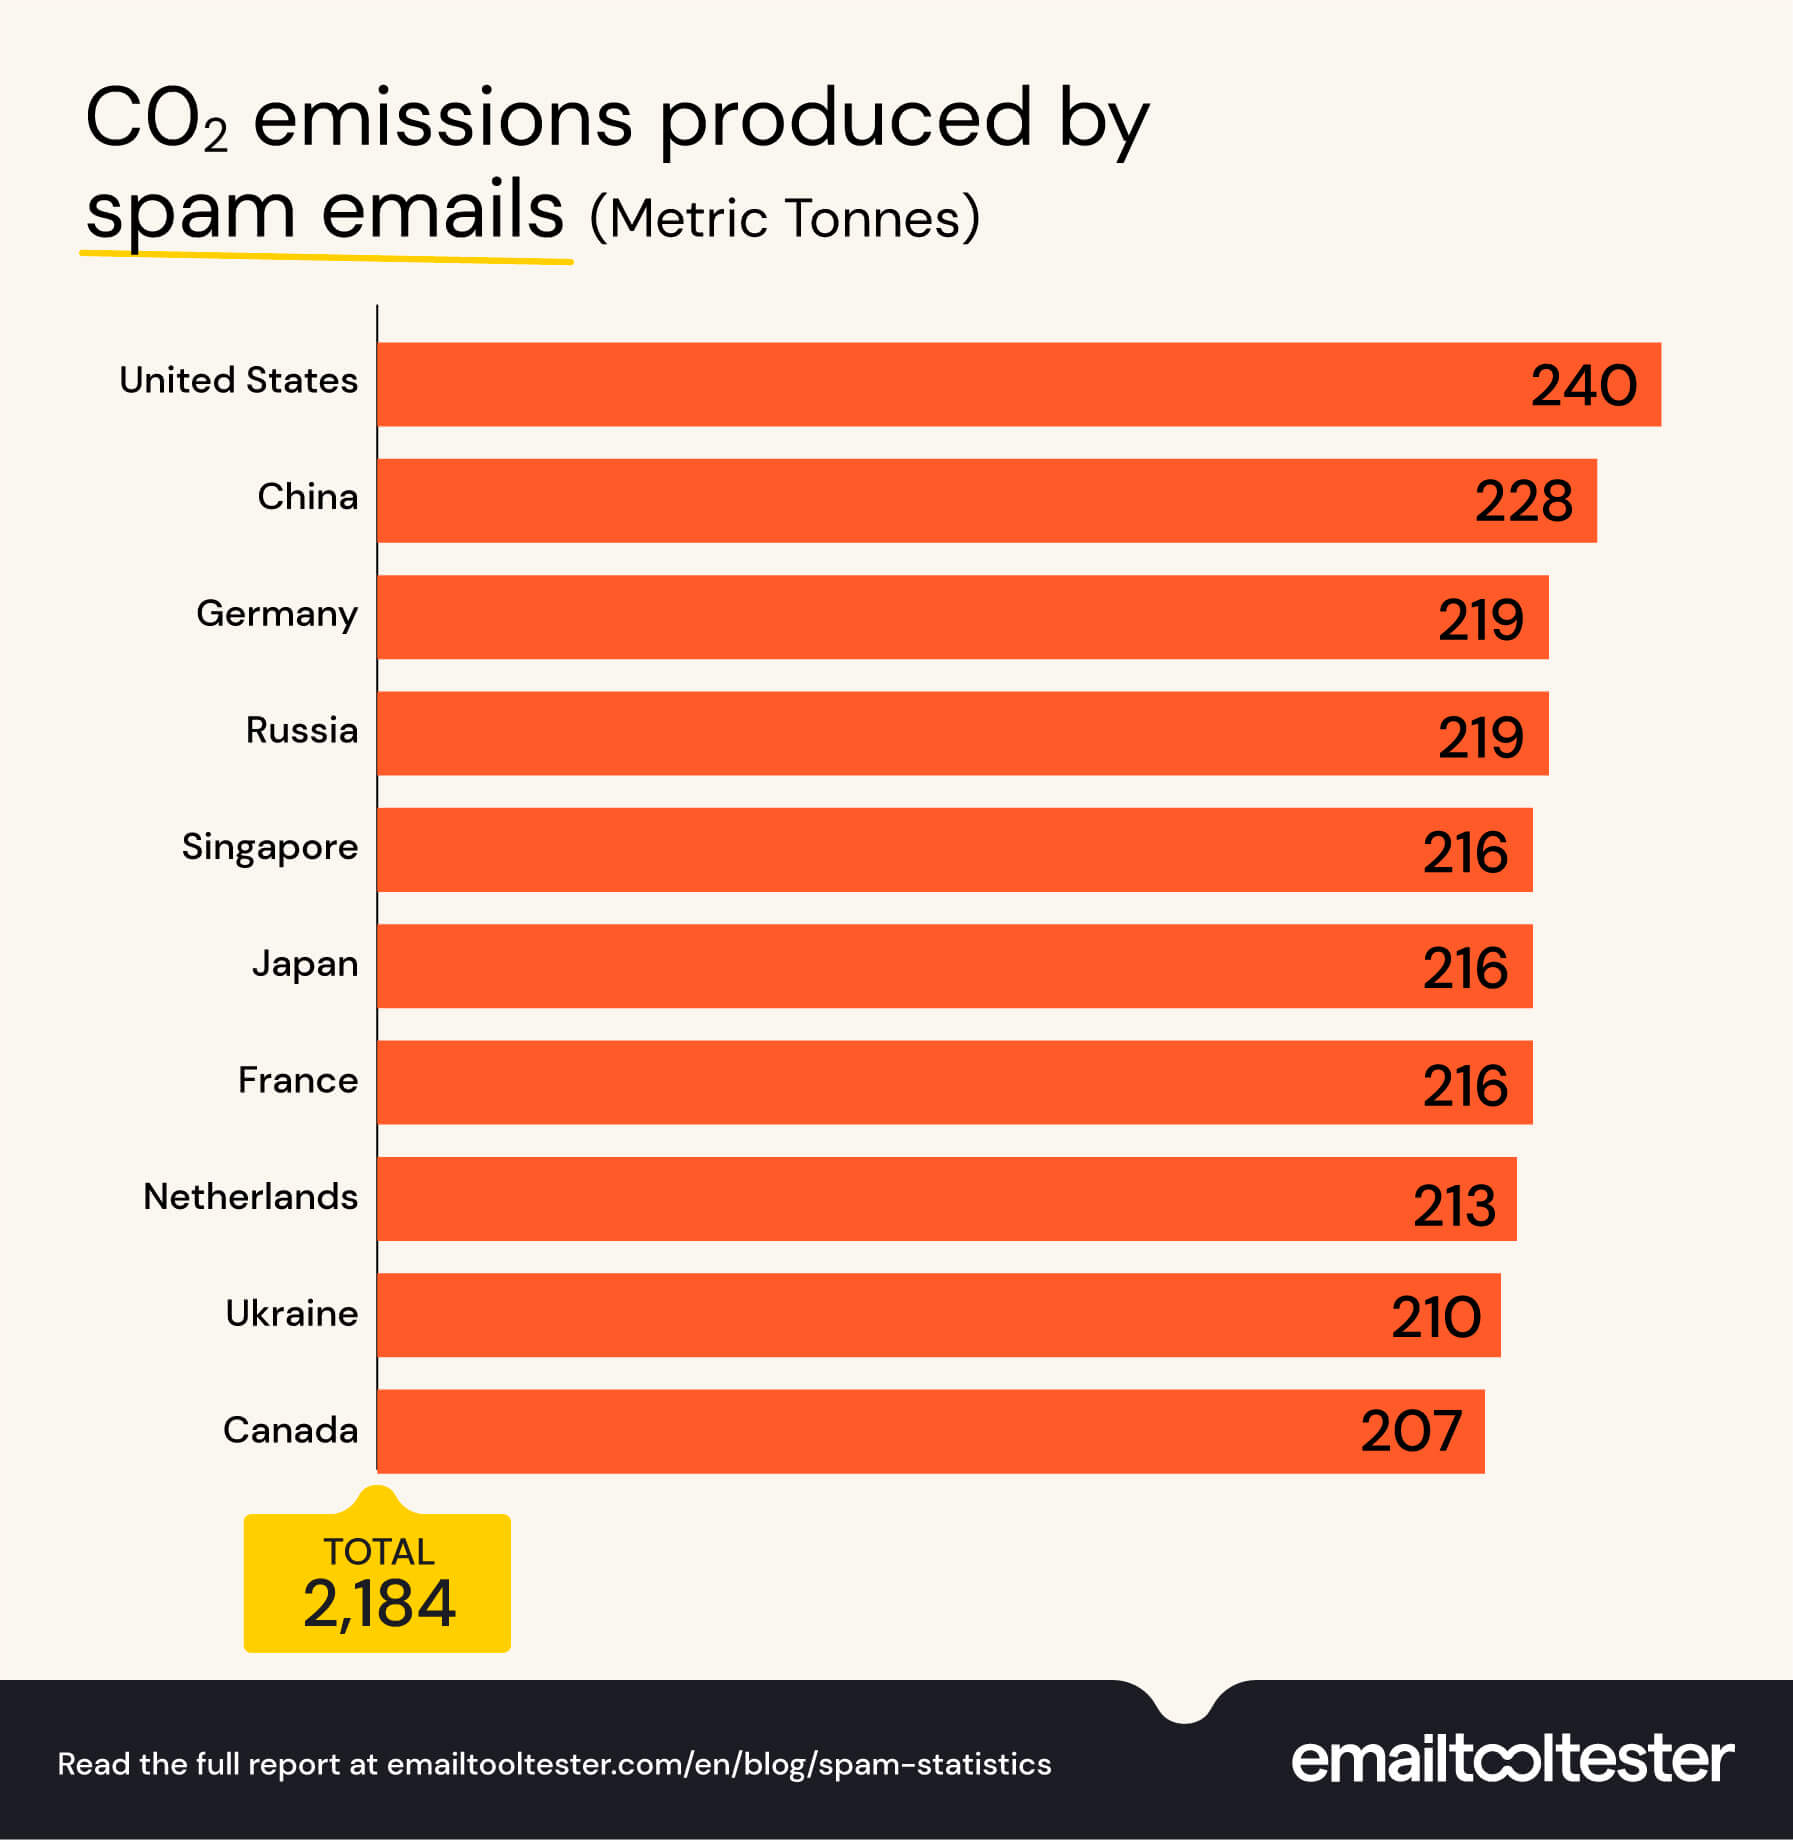
- The ten countries that send the most spam emails produce 2,184 metric tonnes of CO2 every day, or 797,160 over the course of one year from spam emails alone. In one day, that’s equivalent to 5.3 million miles driven in a conventional gas car, or 1.9 billion miles over the course of a year.
- Over three-quarters (77%) of people who have fallen victim to an AI phone scam have lost money to the scammers.
Number of spam emails is increasing (even as % decreases)
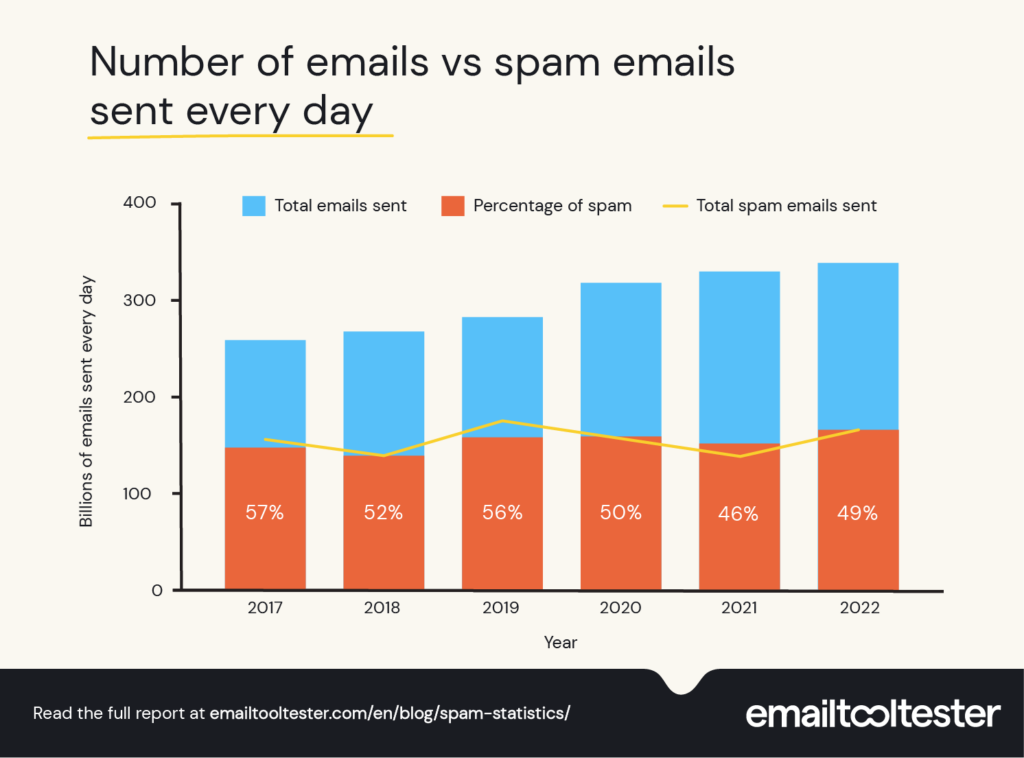
The total number of emails sent every day increases each year. Between 2017 and 2025 that daily total grew from 269 to 376.4 billion.
At the same time, spam's share of email traffic has started climbing again. After years of decline (from 2017 to 2023), however, the trend has started to move in the opposite direction.
In 2025, spam accounted for roughly 52% of all emails sent worldwide—meaning more than half of global email traffic is unwanted.
How many spam emails are sent per day?
In 2023, 45.6% of all emails were classified as spam—a figure recorded at a time when around 160 billion emails were being sent worldwide each day.
Just two years later, the volume of global email traffic had surged dramatically to 376.4 billion emails per day. Spam's share of that traffic also climbed along with it, at 51.8%.
This latest figure could indicate that spam is once again on the rise.
Between 2017 and 2023, the percentage of total email traffic identified as spam had consistently decreased (from 56.63% in 2017 to 45.6% in 2023). Security experts put this down to action against botnets (networks of hijacked computers that have historically been used to send spam).
This uptick isn’t too much of a surprise. Spammers are finding more clever ways to operate, likely aided by automation, AI-generated content, and the continued growth of global email traffic.
Most people have received scam or phishing-related messages
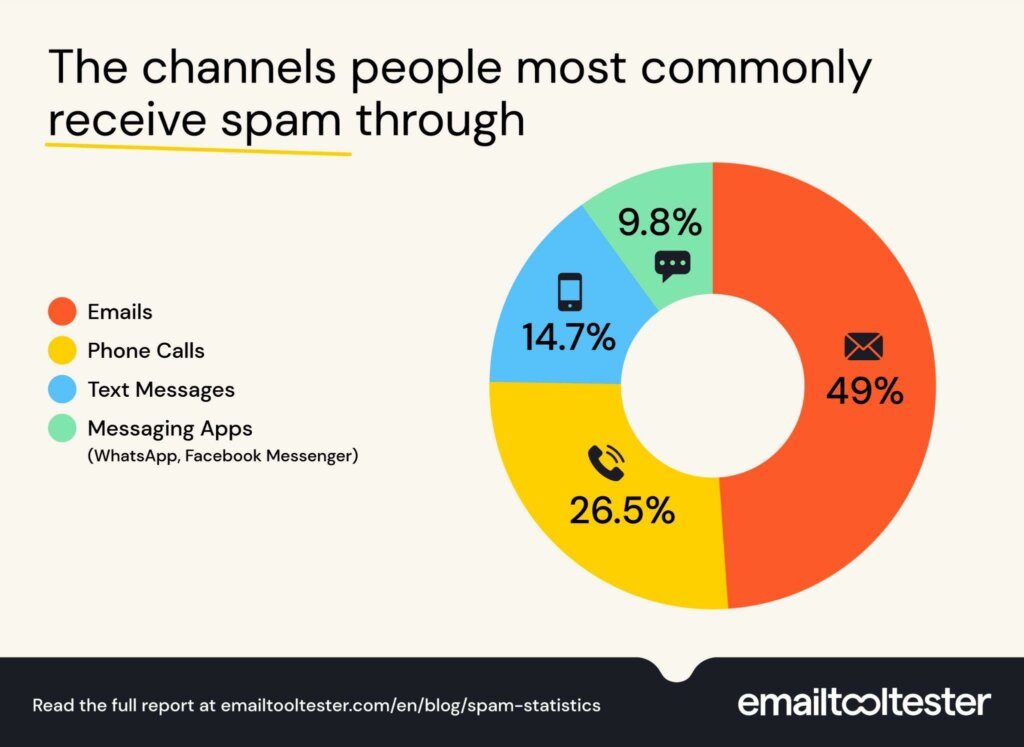
We carried out a survey which found that the vast majority (96.8%) of people have received spam messages relating to scams through emails, text messages, phone calls, or other types of messages.
The most common channel people say they receive spam through is email, with almost half (49%) saying they receive spam via emails most often. This was followed by phone calls (26.5%), then text messages (14.7%), and messaging apps like WhatsApp and Facebook Messenger came lowest with 9.8%.
Over half of people have lost money to online or telephone scams
Of the 96.8% of respondents who had received messages or calls involving scams, 57.1% of this group said that they had lost money as a result of the scam. The most common amount people said they had lost in total because of these scams was $100-$249, however, 2.9% said they had lost over $1,000.
Countries with the worst spam issues
Some countries have worse spam issues than others, often due to weak or non-existent anti-spam laws that allow spam operations to be carried out more easily.
US has the most spam-emitting IP addresses
Research points to the US having the most compromised email-sending IP addresses.
The latest figures show that the US currently has 698,343 IP addresses exhibiting signs of compromise—more than double the number recorded in China, which ranks second with 289,494.
These figures refer to IPv4 and IPv6 addresses hosted in each country that show signs of being compromised and potentially used for malicious activity, including spam distribution.
What's particularly interesting is China's progress. When we first conducted our research, China recorded 771,021 compromised IP addresses. Today, that figure has dropped to 289,494. Whatever they're doing, it appears to be working.
| Country | Number of current live spam issues |
|---|---|
| United States of America | 698,343 |
| China | 289,494 |
| Brazil | 157,598 |
| United Kingdom | 139,805 |
| India | 115,153 |
| Indonesia | 84,673 |
| Vietnam | 70,724 |
| Algeria | 65,047 |
| Bangladesh | 58,161 |
| Russia | 55,666 |
Source: Spam Haus
Russia sends the most spam emails per day
Having the highest number of compromised IP addresses doesn't necessarily mean a country sends the most spam emails.
In fact, Russia has overtaken both the US and China when it comes to spam volume. As of December 2025, it holds the top spot, with 32.5% of global spam emails originating from Russian IP addresses.
China ranks a distant second at 19.1%, while the US accounts for 10.57%.
The figures show that while the US hosts the largest number of compromised IP addresses, Russia's spam infrastructure is generating far more spam traffic overall.
| Country | % of spam emails sent |
|---|---|
| Russia | 32.5% |
| China | 19.1% |
| US | 10.57% |
The environmental impact of spam emails
When it comes to sending and receiving emails, the environmental impact is something that can be overlooked. Data from Carbon Literacy shows that a short email sent and received on a phone can produce 0.2g of carbon emissions, while a spam email picked up by filters can produce 0.03g of carbon emissions.
We used this information to determine just how much carbon was being produced by spam emails sent from the countries that send the most spam. The 8 billion spam emails sent from the U.S. each day will generate 240 metric tonnes of CO2 emissions. Over a year this would add up to a total of 87,600 metric tonnes of CO2.
For the top ten countries combined, spam emails produce 2,184 metric tonnes of CO2 every day, or 797,160 over the course of one year. In one day that’s equivalent to 5.3 million miles driven in a conventional gas car, or 1.9 billion miles driven over a year.
The most common topics of spam emails
Spam emails can contain a wealth of different topics from scammers posing as your bank to fake prizes telling you how to claim your ‘jackpot’. We asked our survey respondents which themes they see most commonly in the spam emails they receive.
The topic most commonly seen in spam emails is prizes and giveaways, with 36.7% of people saying this is one of the top themes they see. This was closely followed by emails relating to job opportunities (36.3%), and banking-related scams came in third at 34.6%.
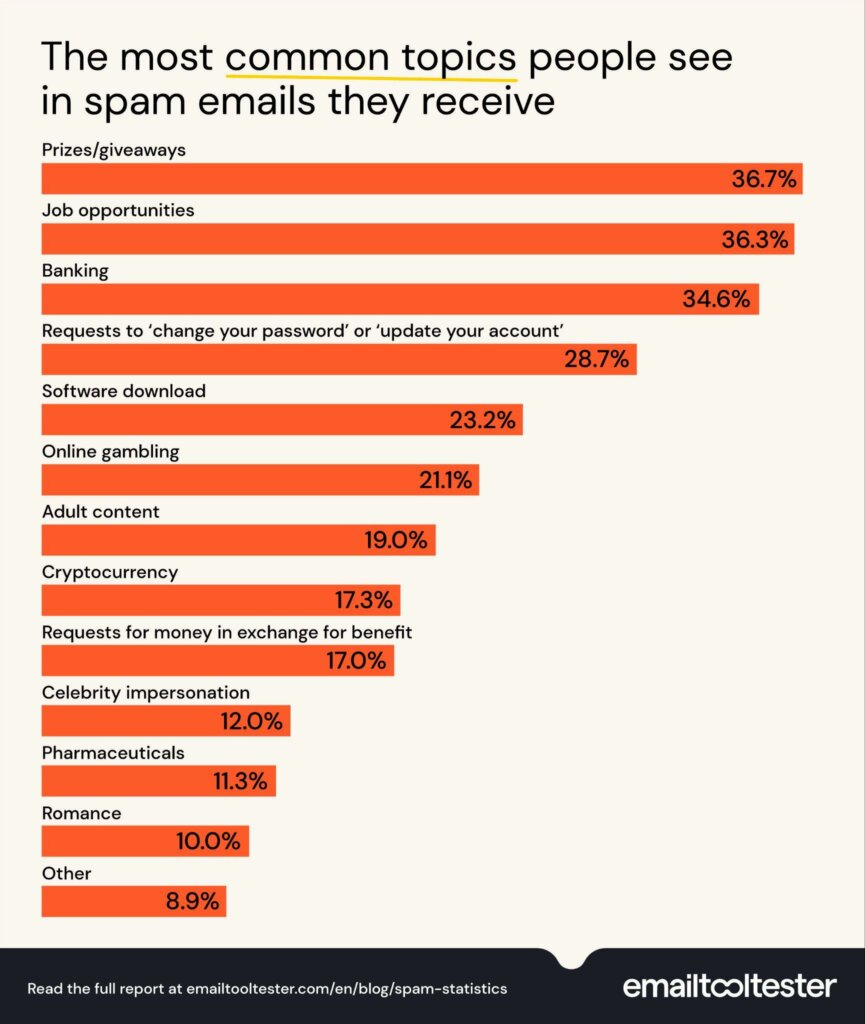
*Respondents were able to choose up to three options.
In terms of AI-assisted threats, fraudulent offers topped the list at 18.6%. Common examples include free phones and airline rewards. Financial service providers asking for security updates come in second (13.15), followed by invoice lures (8.3%) and impersonated HR teams (8.2%).
We’ll talk more about the role of AI in spam in a later section
Spam text statistics
Robokiller estimates that Americans received a total of 78 billion automated spam texts throughout the first half of 2023, with most texts being received in January and May (14 billion each). In total, this is a $4 billion increase year-over-year compared to the same period in 2022.
| Spam texts per month USA | |
|---|---|
| Month | Estimated number of scam texts |
| January 2023 | 14,000,000,000 |
| February 2023 | 11,000,000,000 |
| March 2023 | 12,000,000,000 |
| April 2023 | 13,000,000,000 |
| May 2023 | 14,000,000,000 |
| June 2023 | 13,500,000,000 |
Delivery services are the most common topic of spam texts
There were over 1.1 billion scam texts relating to delivery services sent in the U.S. in the first half of 2023, making this the most common topic used in these kinds of texts. This was followed by bank-related content with 365 million texts and travel-related content with 179 million texts.
| Estimated top robotext categories 2023 | |
|---|---|
| Delivery | 1,129,510,869 |
| Bank scams | 363,928,213 |
| Travel | 179,443,012 |
| COVID-19 | 151,297,143 |
| Apple + hardware | 141,134,560 |
Losses to text scams
Scammers using SMS scams stole an estimated $13 billion between January and June 2023. These scams typically impersonate legitimate businesses, like delivery companies or banks, and trick people into clicking links or sharing personal information.
In 2025, the figure ballooned to $80 billion. Fortunately, Juniper Research predicts this will fall by 10% in 2026. Hopefully, the trend continues over the coming years.
Spam call statistics
Spam calls are the most common type of computer-automated phone calls (or robocalls), with 155 million spam robocalls made in 2023. (Source: Hiya)
Unfortunately, when Hiya conducted another study in 2026, 39% of respondents reported that the number of spam calls they receive continued to increase.
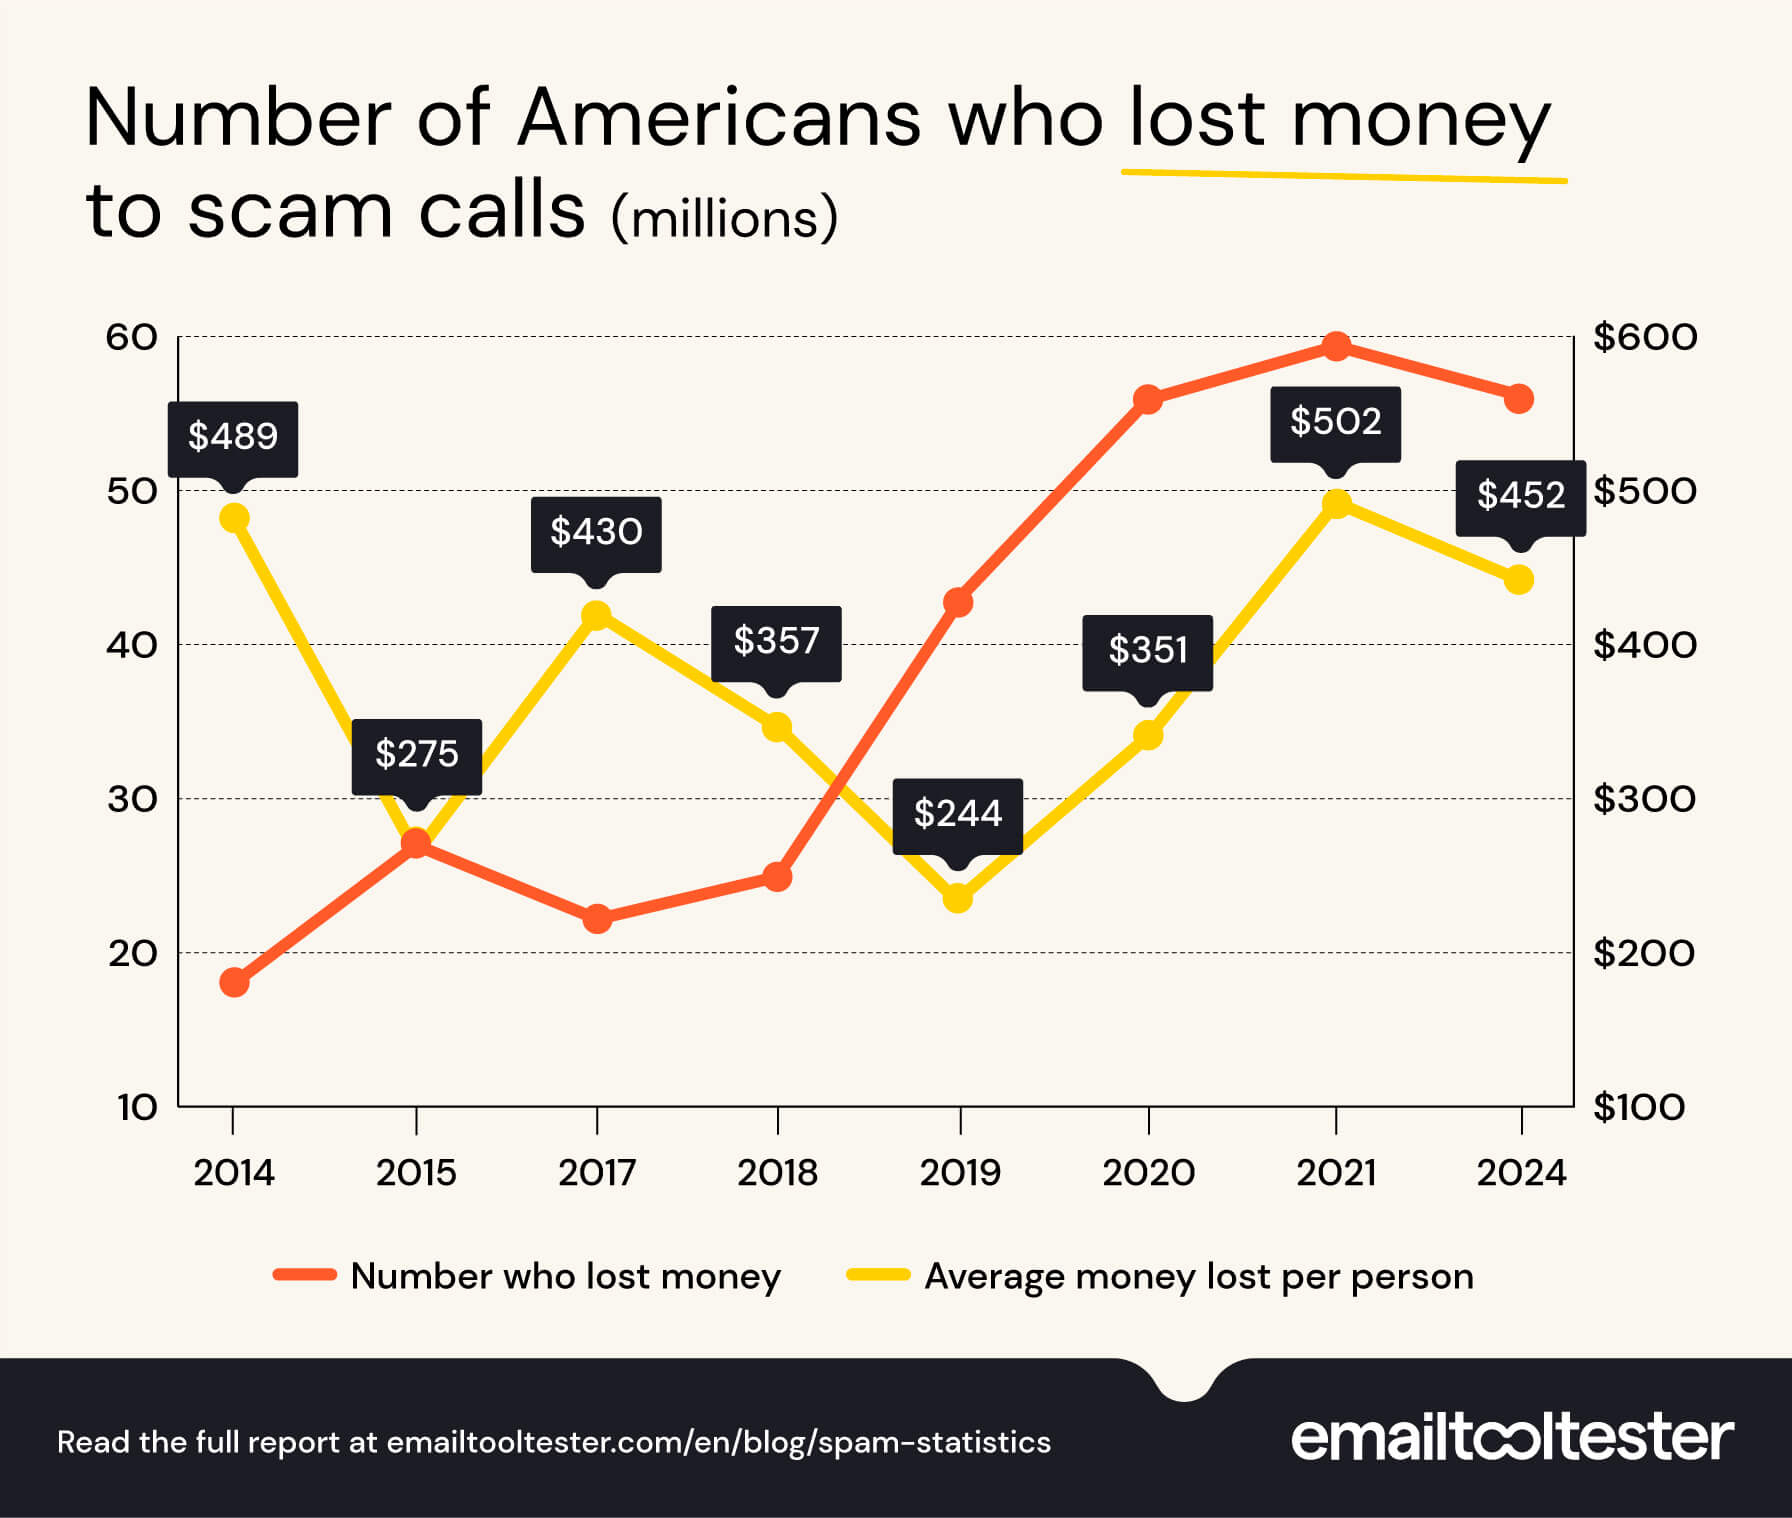
Americans lose $452 to scam callers on average
The latest figures from TrueCaller show that a total of $25.4 billion was lost to scam callers by 56.2 million people in a one-year period, meaning victims lost $452 on average. The number of people losing money to scam calls has increased dramatically compared to 2014 when 18 million people lost a total of $8.6 billion.
| Year | Number of Americans who lost money to scam calls (millions) | Total money lost (billion USD) | Average money lost |
|---|---|---|---|
| 2014 | 18 | $8.60 | $489 |
| 2015 | 27 | $7.40 | $275 |
| 2017 | 22.1 | $9.50 | $430 |
| 2018 | 24.9 | $8.90 | $357 |
| 2019 | 43 | $10.50 | $244 |
| 2020 | 56 | $19.70 | $351 |
| 2021 | 59.4 | $29.80 | $502 |
| 2024 | 56.2 | $25.40 | $452 |
In 2026, Hiya’s survey estimates that respondents from the USA had lost US$682 in a span of one year, while Canadian respondents averaged a loss of CA$1,208 stemming from spam phone calls.
Europeans also lose hundreds to phone scams each year
Of the 12,000 Hiya global respondents, some 15% lost money to a phone scam in the past year.
Apart from North Americans, Europeans were among the most likely to report doing so. Among the countries surveyed, victims in the UK reported the highest average losses at £784, followed by Germany (€749), France (€628), and Spain (€515).
Victims of scam calls
In total, women receive the most scam calls in age groups between 18 and 54, but men aged over 55 receive more scam calls than women in this age group. Men aged 65 and over receive the most scam calls at an average of 35.5 per month, though this is only slightly more than women over 65 receive (35.4).
Hispanic and Black Americans are twice as likely to lose money to phone scams as White Americans. Almost half (47%) of Black Americans and 36% of Hispanic Americans say they have lost money to phone scams at least once, compared to 25% of White Americans.
The category of spam calls and texts also varies by ethnicity, with White people receiving more fraudulent communications about deliveries, vehicles and politics, while Hispanic Americans received more spam communications about student loans. (Source: TrueCaller)
Some countries receive more spam calls than others
One study into telephone spam found that the scale of spam calls varies greatly from country to country. In this context, spam is defined as unwanted calls including fraud and nuisance calls.
Chile has the highest rate of spam calls, with 56.9% of phone calls nationwide being unwanted, and 8.9% (or 15.6 million) of all calls being classed as fraud. This is followed by Indonesia where 56.4% of all calls were spam, with 1.4% being fraud.
Other countries with a high spam call rate include Argentina (56%), Hong Kong (54%), and Brazil (46.4%). The U.S. ranks 16th on the list with 25.3% of all calls being classed as spam.
| Rank | Country | Spam Calls Rate | Fraud Call Rates |
|---|---|---|---|
| 1 | Chile | 56.9% | 8.9% |
| 2 | Indonesia | 56.4% | 1.4% |
| 3 | Argentina | 56.0% | 31.0% |
| 4 | Hong Kong | 54.0% | 12.0% |
| 5 | Brazil | 46.4% | 9.4% |
| 6 | Spain | 44.9% | 5.9% |
| 7 | Mexico | 43.0% | 17.0% |
| 8 | France | 42.5% | 3.5% |
| 9 | Italy | 40.0% | – |
| 10 | Philippines | 29.4% | 8.4% |
| 11 | Australia | 28.3% | 7.3% |
| 12 | Poland | 27.4% | 5.4% |
| 13 | Finland | 27.4% | 4.4% |
| 14 | United Kingdom | 27.3% | 9.3% |
| 15 | Sweden | 26.8% | 5.8% |
| 16 | USA | 25.3% | 1.3% |
| 17 | Germany | 21.6% | – |
| 18 | Canada | 21.3% | 6.3% |
| 19 | Portugal | 21.0% | 1.0% |
| 20 | Singapore | 20.2% | 8.2% |
| 21 | Belgium | 19.2% | 1.2% |
| 22 | Switzerland | 19.0% | 1.0% |
| 23 | Malaysia | 16.9% | 4.9% |
| 24 | Peru | 16.6% | 0.6% |
| 25 | Puerto Rico | 15.7% | 5.7% |
| 26 | Denmark | 15.7% | 1.7% |
| 27 | Turkey | 15.3% | 8.4% |
| 28 | Norway | 15.3% | 2.3% |
| 29 | Netherlands | 13.3% | 2.3% |
| 30 | Czech Republic | 12.8% | 0.8% |
| 31 | India | 12.5% | 5.8% |
| 32 | Greece | 12.3% | 1.3% |
| 33 | Slovakia | 10.4% | 1.0% |
| 34 | Thailand | 10.3% | 1.5% |
| 35 | Israel | 9.0% | 1.2% |
| 36 | Austria | 9.0% | 1.4% |
| 37 | Hungary | 8.4% | 2.5% |
| 38 | New Zealand | 7.9% | 1.1% |
| 39 | Ireland | 4.4% | 1.0% |
Source: Hiya
Spam calls per person
The number of spam calls each person receives also varies by country. People in Brazil currently receive the highest number with an average of 25 nuisance or fraud calls each month. Hong Kong comes in second with 20, followed by Chile with 18 spam calls per person per month on average.
The countries where people receive the fewest spam calls are the Netherlands, Hungary, New Zealand, and Ireland with only one spam call per person per month on average.
| Rank | Country | Spam Calls Per Person Per Month |
|---|---|---|
| 1 | Brazil | 25 |
| 2 | Hong Kong | 20 |
| 3 | Chile | 18 |
| 4 | Mexico | 16 |
| 5 | USA | 12 |
| 6 | Spain | 10 |
| 6 | Italy | 10 |
| 6 | India | 10 |
| 9 | France | 9 |
| 10 | Puerto Rico | 8 |
| 11 | Indonesia | 7 |
| 11 | Argentina | 7 |
| 11 | Philippines | 7 |
| 14 | Poland | 6 |
| 14 | Peru | 6 |
| 16 | Australia | 5 |
| 17 | Finland | 4 |
| 17 | United Kingdom | 4 |
| 17 | Sweden | 4 |
| 17 | Portugal | 4 |
| 17 | Turkey | 4 |
| 17 | Israel | 4 |
| 23 | Canada | 3 |
| 23 | Malaysia | 3 |
| 23 | Greece | 3 |
| 26 | Germany | 2 |
| 26 | Singapore | 2 |
| 26 | Belgium | 2 |
| 26 | Switzerland | 2 |
| 26 | Denmark | 2 |
| 26 | Norway | 2 |
| 26 | Czech Republic | 2 |
| 26 | Slovakia | 2 |
| 26 | Thailand | 2 |
| 26 | Austria | 2 |
| 36 | Netherlands | 1 |
| 36 | Hungary | 1 |
| 36 | New Zealand | 1 |
| 36 | Ireland | 1 |
Source: Hiya
The success rate of online spam
A 2022 report from IBM found that the click rate of an average targeted phishing attack was 17.8%. However, when phishing campaigns included phone calls (voice phishing), they were clicked by 53.2% of recipients, making them three times more effective.
How much money do spammers make?
One example from researchers at UC San Diego found that online spammers made around $7,000 per day on average, this amounts to approximately $2.5 million per year. However, this figure can vary widely depending on the scam operating, with some making very little and some making much more. (Source: UC San Diego)
The industries most targeted by phishing scams
While some phishing scams are targeted at individuals, many of these operations target businesses in an effort to obtain sensitive information or install malware on company computers. Since email is the most commonly used workplace communication tool, it makes sense that these phishing scams are predominantly in the form of emails.
Professional services are the most common targets for business phishing attacks, with 18% of phishing emails or messages being sent to these companies. This is followed by manufacturing companies at 16%, and retail and wholesale brands at 9%.
| Industry | Share of phishing messages received |
|---|---|
| Professional Services | 18% |
| Manufacturing | 16% |
| Retail & Wholesale | 9% |
| Construction | 7% |
| Finance | 6% |
| Real Estate | 5% |
| Insurance | 5% |
| Transport and Delivery | 5% |
| Infotech | 5% |
| Banking | 4% |
| Healthcare | 4% |
| Other | 16% |
These numbers are just for phishing attacks. The most targeted industries shift a bit when you zoom out.
In North America, education is the most targeted sector for any cyberattack, averaging 3,057 per organization per week. Healthcare and Medical come second, having to fend off 2,121 weekly attacks.
AI and spam
With the use of AI tools on the rise, scammers are also making use of this technology to catch people online and over the phone.
AI voice cloning scams
In 2025, FBI reported that Americans lost about $983 million to AI-related scams, which include traditional phishing and vishing (a portmanteau of voice and phishing).
Vishing (also known as AI voice cloning or deepfake voice call) uses the voice of someone you know to gain your trust and convince you to share your personal details or send money. This could be the voice of a friend or family member in distress, or a voice purporting to be from your bank or a government organization.
A survey by McAfee found that 25% of adults had experienced a scam that used an AI voice. 10% of respondents said that they had personally been targeted, and 15% said it had happened to someone they knew. Of those who had fallen victim to an AI voice scam, 77% had lost money to the scammers.
In the UK, Starling Bank reported that 28% of adults say they had been targeted by an AI voice cloning scam at least once in the past year, but 46% of people surveyed said they had not heard of these scams.
In our survey, 81.1% of people said they were aware that AI software is being used to imitate people’s voices in telephone scams, and a similar number (80.8%) said they were concerned about it. However, 63.1% said they were confident they could tell the difference between an AI voice and a human voice.
That confidence may be somewhat misplaced. One in three survey participants reported having received a deepfake voice call, suggesting that many consumers may be more vulnerable to AI-powered scams than they realize.
It’s no surprise that many are taking extra precautions. In fact, 86% of consumers said they now avoid answering calls from unknown numbers altogether.
An increase in spam since ChatGPT’s release
The release of the AI chatbot, ChatGPT, in 2022 provided users with a handy tool that could answer questions, generate content, write emails, and carry out a whole host of other tasks.
Barely a year after its widespread rollout, Darktrace found a 135% increase in ‘novel social engineering’ attacks. The AI chatbot had seemingly provided scammers a way to refine their attacks and increase their frequency.
By 2025, 51% spam emails were reportedly AI-generated. The same can be said for 14% of business email compromise (BEC) attacks.
Hoxhunt also reported a 14x increase in AI-generated phishing emails that could get around email security filters.
Almost three-quarters (73%) of people said that they were concerned that hackers could use generative AI tools like ChatGPT to create spam emails that were almost impossible to distinguish from genuine emails. A Tooltester study found that 63.5% of people can’t identify content made purely by the ChatGPT 4.0 model.
Using AI to protect people from spam
Email providers and cybersecurity companies often use AI to detect online spam and filter it into junk folders or prevent it from accessing a victim’s computer. In fact, Google says its AI-powered spam filtering technology blocks more than 99.9% of spam, phishing, and malware from reaching users’ Gmail inboxes. Google also states that their AI-enhanced filters block almost 10 million spam emails every minute.
Which ESPs reach the inbox most often?
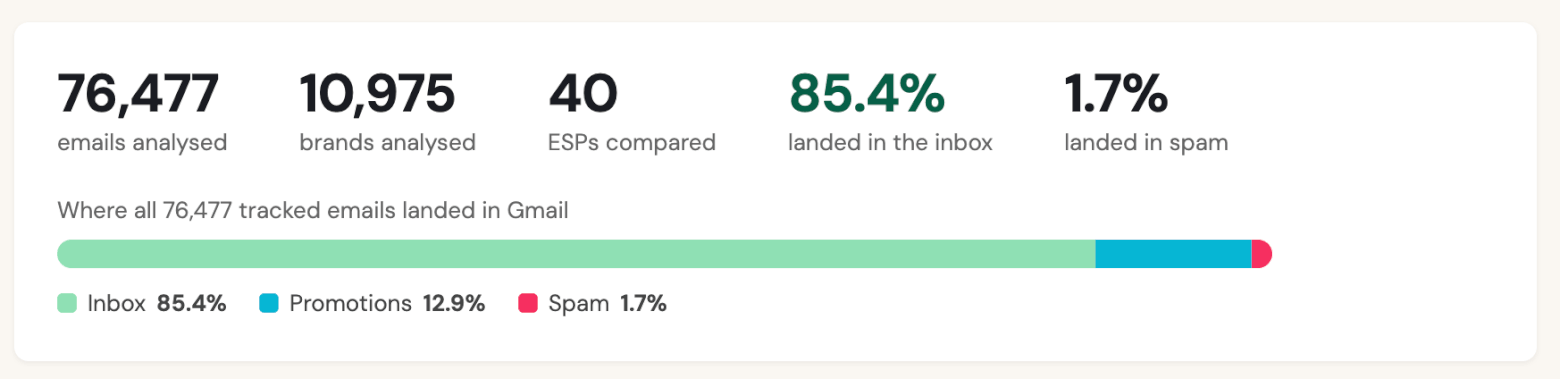
To better understand how legitimate emails perform in actual inboxes, we conducted our own analysis of over 70,000 emails sent by nearly 11,000 brands, using our Email Detective Chrome extension. We tracked which emails landed in the inbox (in tabs, as well) or were filtered into spam folders. The data is based on Gmail accounts only.
Overall, 85.4% of emails successfully reached the primary inbox, and just 1.7% went to spam folders. The rest ended up in other tabs, such as Promotions. (Note that our tracker only detects inbox placement rates for emails that were actually opened, so unopened emails are not included in the dataset.)
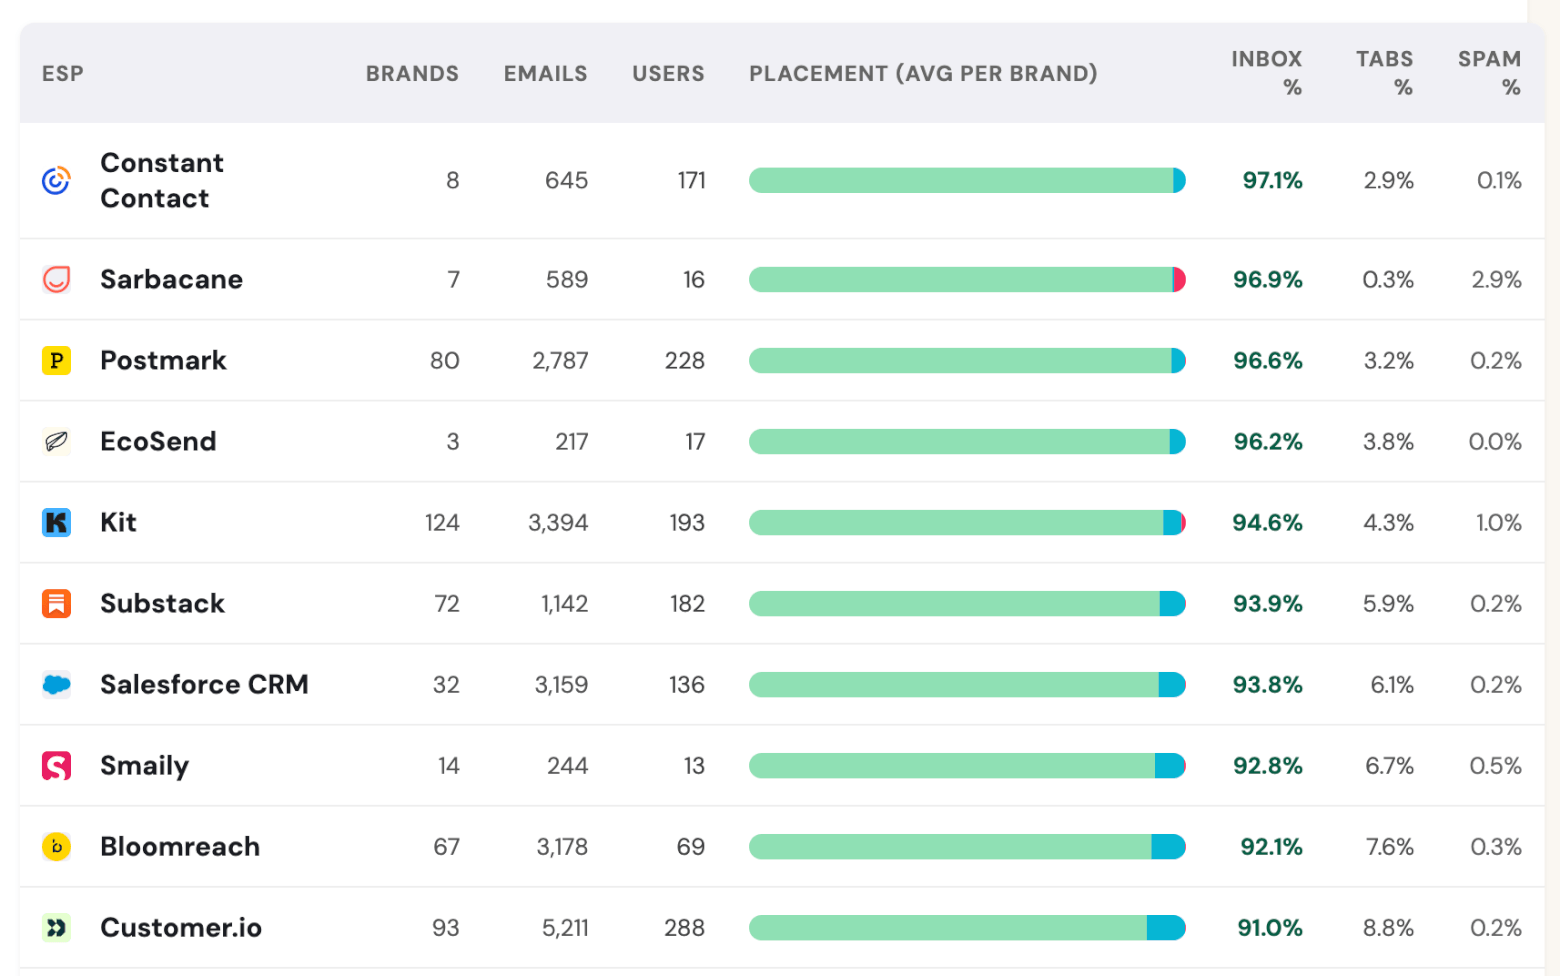
Inbox placement rates vary across email service providers (ESPs). Among the providers analyzed, around 15 scored above 90% inbox rate.
Many platforms showed very strong inbox placement rates, with providers like Constant Contact, Sarbacane, and Postmark leading the pack with over 96.6%.
Bear in mind, however, that the following results reflect more than just the platform itself. Factors such as sender behaviour, list quality, email content, and technical infrastructure all contribute to which folder an email ultimately ends up in.
Inbox placement by ESP (Top 10)
By comparison, the ESPs with the highest spam placement rates were Seguno, Mailchimp and Sailthru:
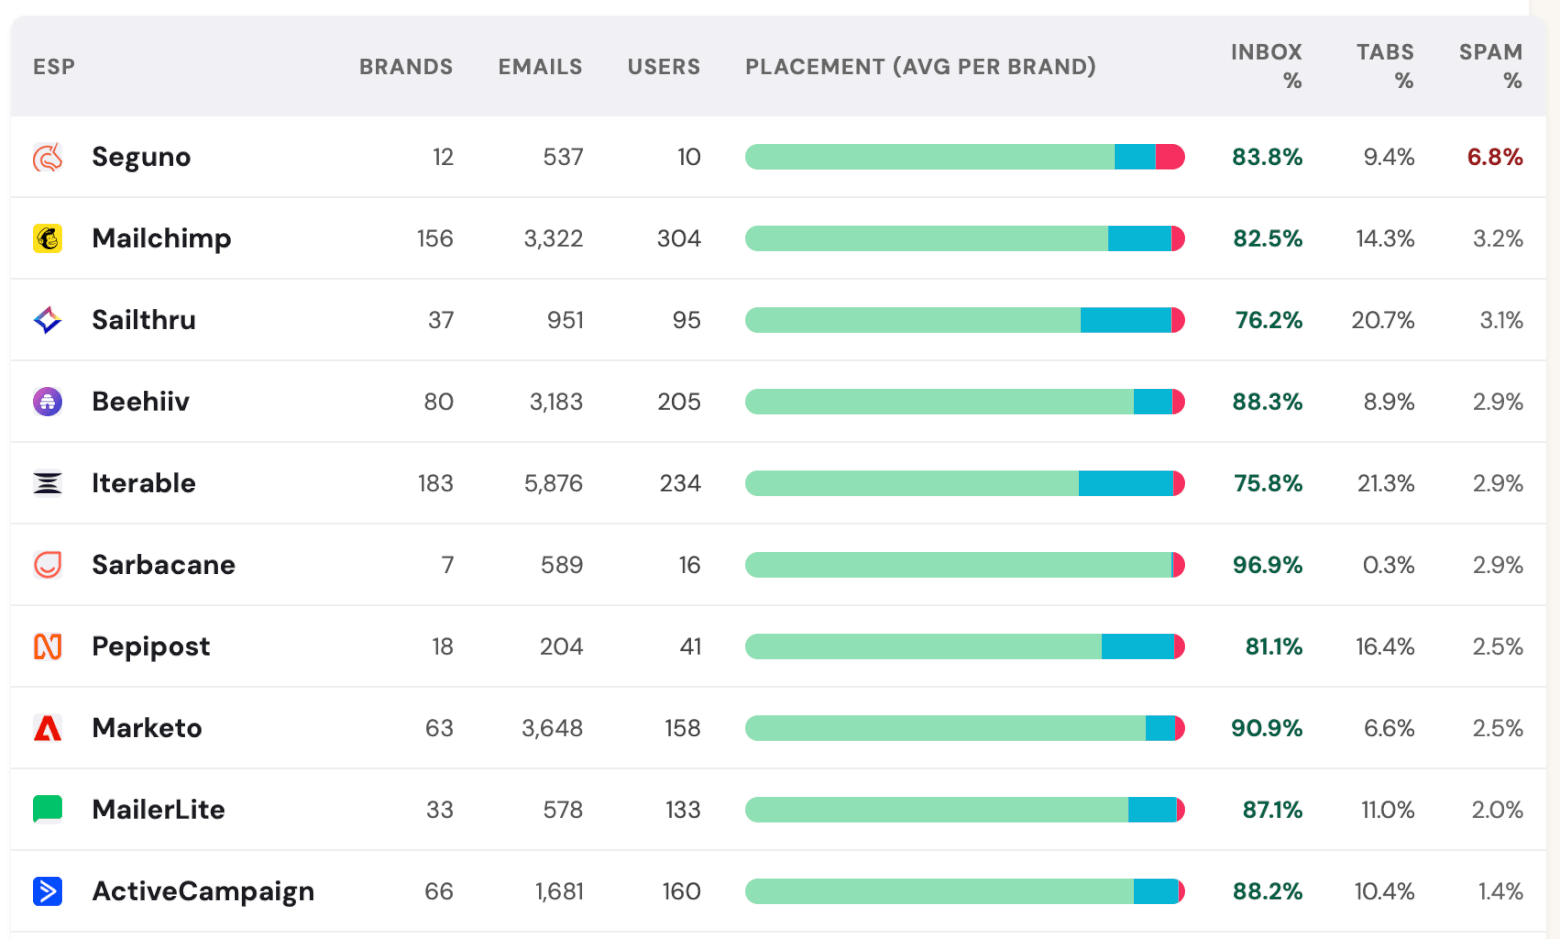
This analysis was conducted using Email Detective for Gmail, a Chrome extension that identifies email service providers and checks authentication details (SPF, DKIM, DMARC) directly within Gmail.
If you’re curious to see it in action, download it here. (Note: Outlook version also available).
Which brands are most likely to land in spam?
Email Detective data also gives us another useful insight: the kinds of senders that may be more likely to fall in spam.
Among domains with a spam rate above 5%, we noticed a clear pattern. Many of the senders fall into categories that mailbox providers tend to treat cautiously: investing, trading, wealth-building newsletters, lead generation, ecommerce promotions, publishing platforms, and high-volume notification emails.
Several of the domains were linked to finance or “make money” content, including investing newsletters, trading-related sites, and income-focused brands. This is not too surprising. Financial emails often use language around wealth, returns, opportunities, retirement, crypto, or exclusive offers. Even when legitimate, this type of content can look similar to scam or high-risk promotional emails, especially if it includes aggressive copywriting, lots of links, or affiliate-style offers.
Lead generation was another noticeable theme. These emails can be permission-based, but the consent path is not always obvious to the recipient. Someone may have signed up through a sweepstake, partner form, comparison site, or co-registration campaign, then later receive emails from a brand they do not strongly recognize. That can lead to lower engagement, more spam complaints, and weaker sender reputation.
We also saw some platform-level effects. For example, domains associated with ecommerce or newsletter platforms may not always represent one single sender, but many different merchants, creators, or publishers using the same sending infrastructure. In these cases, spam placement may be influenced by shared reputation, sender setup, list quality, or the behavior of other senders on the same platform.
Reddit was an interesting outlier. As a major, well-known brand, its issue is unlikely to be trust in the brand itself. A more likely explanation is notification fatigue. Large platforms send huge volumes of automated emails, such as replies, recommendations, community updates, and digests. If users ignore, delete, or mark these emails as spam rather than adjusting their preferences, mailbox providers may start filtering them more aggressively.
It is important to interpret this data carefully. Email Detective can only detect spam emails that users actually open. So these are not necessarily emails that users never wanted. In fact, they may be “wanted but filtered” messages: emails from brands users recognize, but that mailbox providers still distrust because of the topic, sender reputation, links, authentication setup, or past engagement signals.
Overall, the pattern suggests that spam placement is not only about whether an email is legitimate. It is also about how risky the email looks to mailbox providers. Finance, trading, lead generation, promotional ecommerce, shared sending platforms, and high-volume notification emails all appear to carry extra deliverability risk.
People’s thoughts on spam and how it affects them
During our survey, we also asked people their opinions on different topics relating to online spam, and how it has affected them.
Most people (86.5%) said they thought the number of scam messages and emails they receive had increased in the past year. Concerningly, over two-thirds (68.8%) said their mental health had been impacted by an online scam, with 41% of people saying it had impacted their mental health considerably and 27.8% saying it had been affected a little.
Around four in five (79.6%) people said that they knew someone else who had been the victim of online scams or fraud, with 28.8% saying they knew of more than one person who had been affected.
Cold emails = spam?
In another survey we ran on the topic of cold emails, we found that around half (50.9%) said they don’t engage with cold emails at all. 13.7% of people say they delete them straight away, and 10.3% say they mark them as junk.
Catching spam
The overwhelming majority of people (95.9%) think that they’re able to spot spam or fraudulent messages, with 56.6% saying they can pick them out easily. However, 39.3% said they can generally spot them but not always. Almost three-quarters (73.3%) also think that spam filters do a good job of blocking spam emails from entering inboxes.
Check out our study of political emails, which found that Republican emails are more likely than Democrat emails to go to spam.
Survey Methodology
We carried out a survey of 1,044 people in the U.S. between 02/10/23 and 09/10/23 to ask about their experiences with online spam and scam-related communications.
The breakdown of the survey respondents was as follows:
- Male: 54.2%
- Female: 44.9%
- Non-binary: 0.4%
- Preferred not to say: 0.5%
- 18-24: 4.5%
- 25-34: 38.1%
- 35-44: 38.3%
- 45-54: 10.9%
- 55-64: 5.4%
- Over 65: 2.7%
The authors
Learn more about us

We keep our content up to date
18 Jun 2026 - Updated statistics for 2026 + new data from Email Detective
16 Oct 2024 - general update
23 Aug 2024 - Updated number for total number of spam emails
Our Methodology
This article has been written and researched following our EmailTooltester methodology.
Our Methodology